
Mobile consumers face a challenging decision at the beginning of their device-based journey: Which platform do I choose? It shouldn’t be as big of a question as it is, but there’s evidence to suggest that users on both platforms differ in personality. Much of this has to do with feature level differences: Android has more device variety and is more customizable, whereas iOS is known for its uniformly sleek design and user-friendly interface. When it comes to apps though, there are fewer gaps and they mostly relate to Apple’s strictness around push notifications and Google’s lack thereof. For instance:
- Android push notifications arrive on the lock screen and remain until the user views them in-app, whereas iOS notifications arrive and then disappear following device open. In iOS, notifications are then stored in the notification center, but the fact that they are not persistent makes it more of a challenge for iOS marketers to keep their messages top-of-mind for users.
- iOS does not allow apps to automatically opt users in to push, whereas Android does. This can be remedied by asking users to opt-in after you’ve built trust with them in the first few sessions, but be sure to strategize knowing that users are looking for value from the start.
Using data as our guide, let’s define how app marketers should approach messaging on both platforms.
Android takes first place in push
The limitations on iOS push play out in our data, where metrics such as open rate, conversion rate, and sessions per user following push receipt are stronger on Android than on iOS.
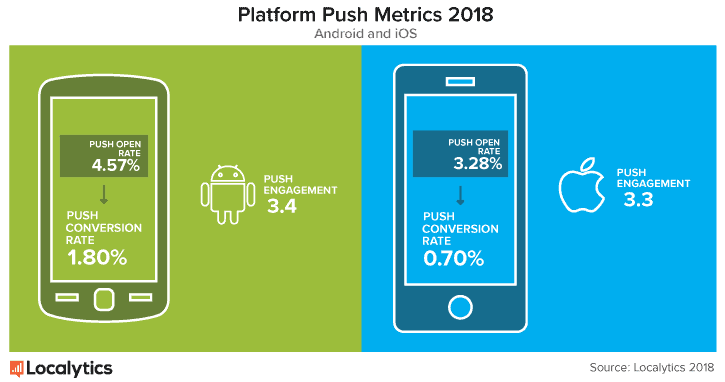
On average, iOS push notifications are opened 3.28% of the time and 0.7% of users complete a desired conversion event, while Android pushes are opened 4.57% of the time and 1.8% of users convert. Android users complete an average of 3.41 sessions within seven days of push receipt, while iOS users complete 3.27 sessions. Android users may open more pushes simply because they’re perceived as more urgent, but they also convert at a higher rate and have slightly more sessions following receipt. When it comes to retail apps, this effect may be offset by the fact that iPhone users spend three times as much as Android users do on mobile eCommerce sites.
Android performs better than iOS in the regular push arena, but digging deeper reveals that iOS users open rich pushes at a rate 20% higher than average, while Android users open rich pushes 4% less than average. On the other hand, iOS users are less likely to convert after receiving a rich push than they are after receiving a regular push.
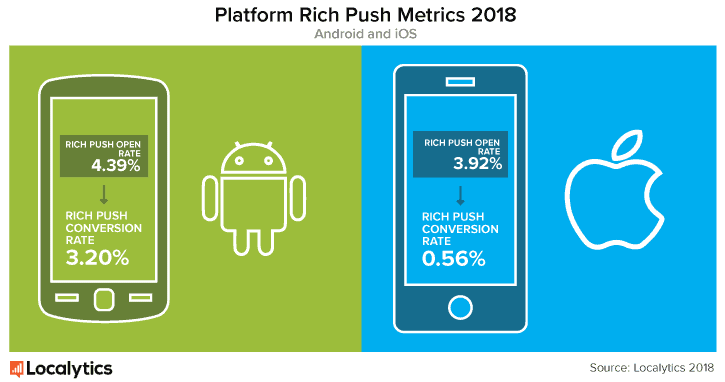
3.92% of iOS rich pushes are opened, compared to 4.39% of Android rich pushes. The message is that iOS marketers who work to craft enticing visual pushes see higher open rates than they do with regular push notifications. This is likely because rich pushes break up the more uniform experience that iOS is known for and offers flashy visuals that may appeal more to extraverted, status-driven personalities. On the other hand it’s possible for rich push to become overwhelming and make users less likely to open a message or convert.
iOS comes out ahead with in-app messages
When it comes to in-app messaging, Apple’s reputation for a pristine experience is unbeatable. iOS in-app messages are opened more frequently, drive better conversion, and are more engaging to users than those on Android.
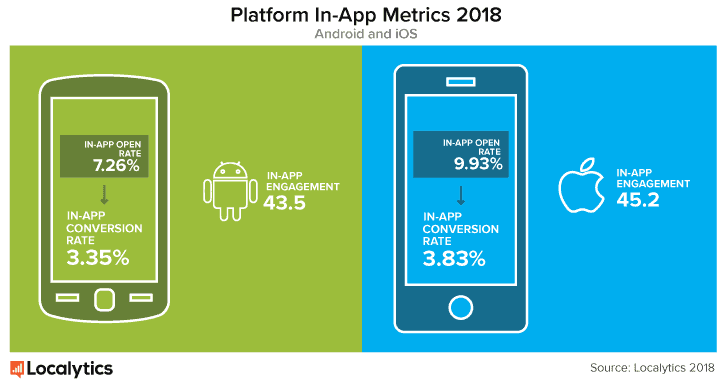
On average, in-app messages on iOS have an open rate of 9.93%, compared to Android’s 7.26%. iOS’s in-app messages convert at a 3.83% rate, with Android coming in slightly lower at 3.35%. Despite this, iOS and Android in-app message engagement hover within 1-2 sessions of each other: users spend 45.2 sessions on average within seven days following in-app receipt on iOS and 43.5 sessions on Android. Marketers should strive to work with the Apple experience when strategizing for iOS – users like communication within the app more than potentially being interrupted outside of it.
At the end of the day, who is more engaged?
If Android takes the lead on push notifications and iOS wins with in-app, then which platform is the most engaged overall? We can answer this question with a simple metric: how much time does the average user spend in an app over the course of a month (aka Time in App)? There is actually a notable difference in total app usage over the course of a month, with Android just barely edging out iOS.
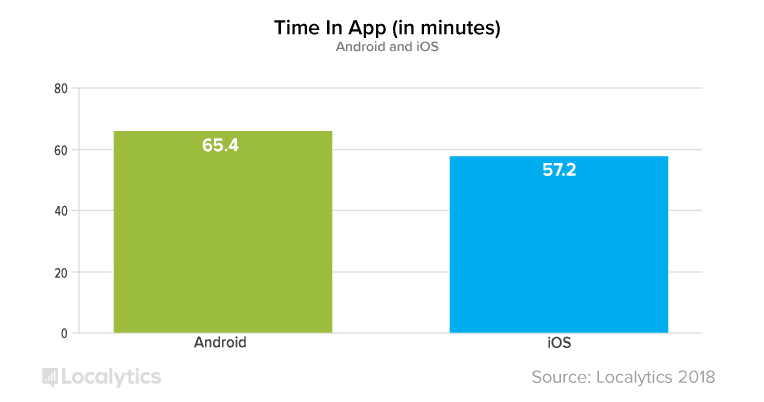
There are multiple possible explanations for this disparity in overall app use, but one that is supported by hard data is the demographic composition of users in both buckets. iPhone users tend to be more extraverted than Android users and tend to perceive their devices as a status symbol, so Android users may spend more time on their phones and less time chatting. iPhone users may be more inclined towards material ownership as opposed to a variety of features they can take time to explore. It’s also possible that Android users are experimenting with the sheer number of apps in the Google Play store (3.3 million in June 2018), while iOS users must be content with a measly 2.2 million.
It appears that Android is overtaking iOS in a contest of app engagement, proving that it can be just as effective at delighting end-users as its counterpart. On the other hand, iOS’s in-app experience is arguably better. Only time will tell how the market will evolve in the future, but Android’s momentum seems to be making a comeback.
Methodology
Localytics is the leading analytics and marketing platform for mobile and web apps across more than 1 billion devices and 28,000 apps. Localytics processes 50 billion data points monthly. For push and in-app open rates, we looked at the number of times users opened messages within one day. Conversion rates are defined as the percent of users who performed a conversion event within seven days. Engagement (or sessions per user) is defined as the average number of sessions users completed within seven days. The timeframe for this study was January 1, 2018 to June 30, 2018.