
Considering 57% of U.S. travelers feel that brands should tailor their information based on personal preferences and past behaviors, and 80% of travelers use a smartphone app to research a trip, it follows that mobile app marketing should be a primary focus for travel companies.
In the past, we’ve found that travel app users are among the most loyal in the mobile space. This time around, the tune has changed slightly: users are much more likely to open push and in-app messages and convert, however these users have become slightly tougher to keep around. We dove into our mobile benchmark report for the second half of 2018 to get a better sense for how the data is trending and why, uncovering the some fascinating insights in the process.
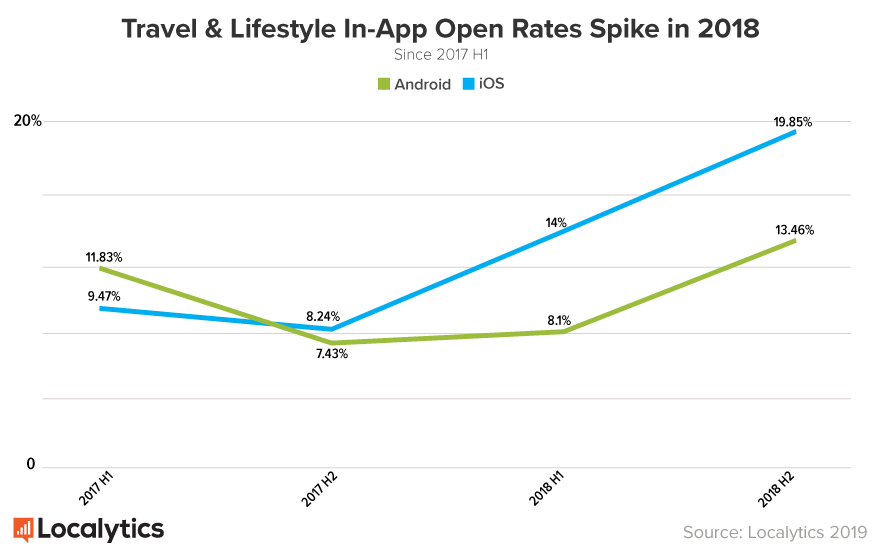
Insight #1: Travel and Lifestyle app notification open and conversion rates have increased considerably since 2017.
Open rates across both Android and iOS initially saw a decrease starting in 2017, but regained momentum and have been reaching new heights in 2018.
In-App open rates for Android apps began at around 11.83%, with iOS at around 9.47%. They both dipped a few percentage points, then sprang up to reach 19.85% for iOS and 13.46% for Android. Travel in-app open rates are rivalled only by Retail and eCommerce’s, which saw a high open rate of 19.63% on iOS for H2 2018.
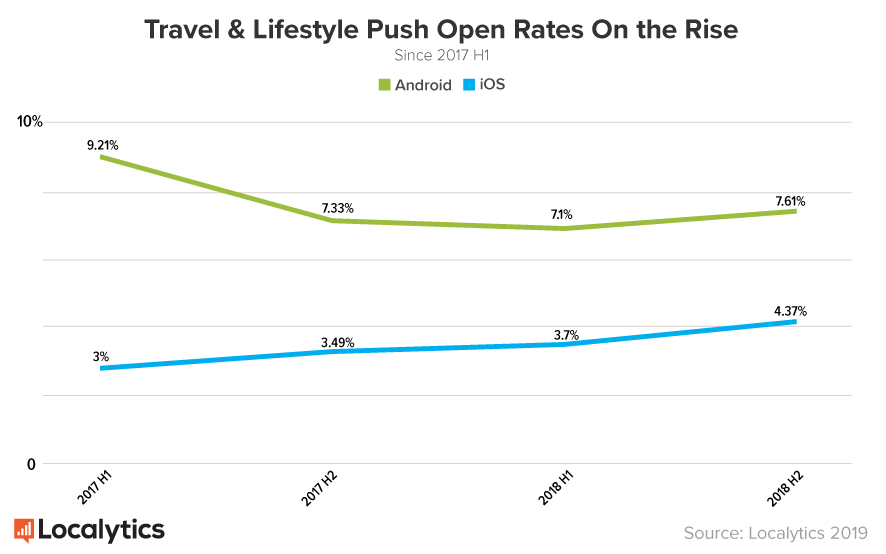
While not nearly as dramatic, push open rates have been steadily increasing on iOS and making a comeback on Android.
At the same time, conversion rates for Travel & Lifestyle apps have also been on the rise, indicating stronger in-app and push messaging and ease of conversion.
| 2017 H1 | 2017 H2 | 2018 H1 | 2018 H2 | |
|---|---|---|---|---|
| Android In-App Conversion Rate | 2.97% | 2.55% | 4.9% | 3.65% |
| iOS In-App Conversion Rate | 2.78% | 5.35% | 4.6% | 4.26% |
| Android Push Conversion Rate | 0.39% | 1.05% | 0.94% | 1.62% |
| iOS Push Conversion Rate | 0.2% | 0.38% | 0.46% | 0.78% |
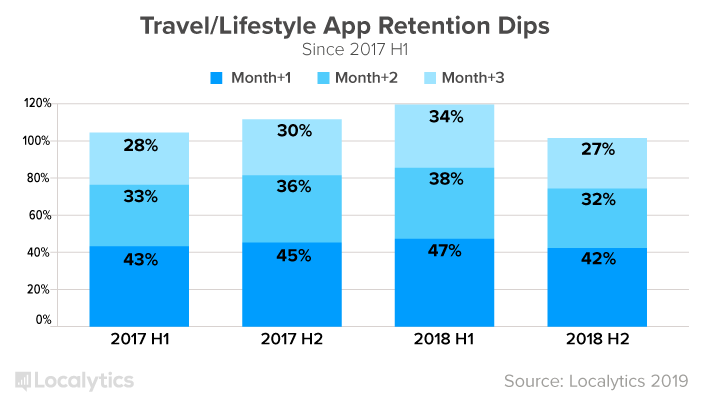
Insight #2: Retention has dipped slightly since the first half of 2018.
Retention measures the percent of users who return to an app one month, two months, and three months after the app is downloaded. Churn is the opposite; it measures the percentage of people who do not return to an app one month, two months, and three months after download.
Although push and in-app have been showing great improvement since 2017, retention is another story. Travel apps performed well on this metric in early 2018, but have struggled to keep up in the second half of the year.
Reducing churn by 5% can increase profitability by 75%. Focusing on customer retention is key to growing and maintaining great mobile apps and customer communication and knowledge should be the app marketer’s highest priority. Travel app marketers: keep the end-user in mind at all times and create an immersive app experience by building effective onboarding strategies and indicating the value your app provides to users from first launch.
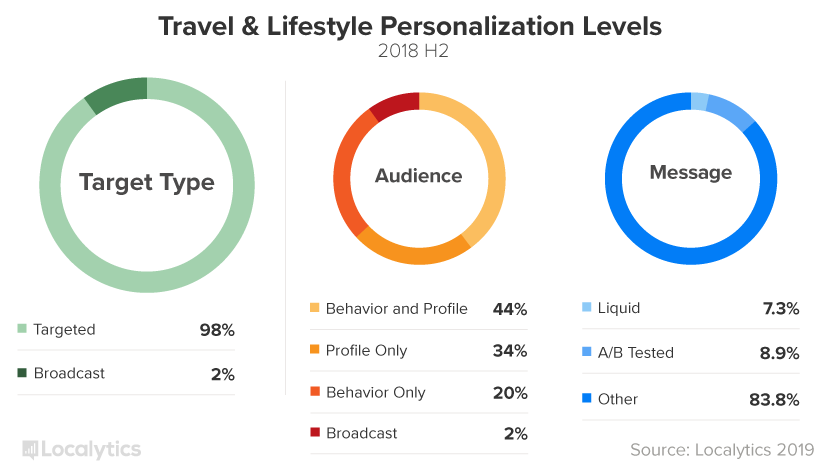
Insight #3: Targeting, liquid usage, and A/B test usage is extremely strong.
When it comes to personalization, Travel & Lifestyle app marketers cannot be beaten. They target audiences in 98% of their messaging, only broadcasting 2% of their messages. 44% of their messages are targeted towards audiences based on behavioral and profile attributes. Behavioral attributes tell you what a user has done in the past in your app, while profile attributes tell you who a user is.
Liquid content is messaging catered to specific users based on information about them. For example, a message might read “Want to create your own fantasy {favorite_sport} team? Try it out with players from {favorite_team}!” This content varies according to the user’s profile information. A/B testing can be used by marketers to test out certain messages on an audience, in the process discovering what types of communication the audience prefers. App marketers in the travel vertical use liquid content to enhance 7.3% of their messages and A/B test nearly 9% of the time.
Insight #3 lends credence to Insight #2: personalization brings great results. Here are two areas where we find strong personalization impacts marketing positively:
- Messages whose audiences use both profile and behavioral criteria have 2.2X higher conversion rates than messages whose audiences used just profile criteria.
- Targeted, liquid messages have nearly 3X higher open rates than simple broadcast messages.
Keep these data points in mind next time you’re building a mobile marketing campaign and are considering whether to broadcast the message to all users or to target based on segmentation data.
Travel App Marketers: Focusing On Improving the App Experience
In closing, the progress travel app marketers have made in push and in-app is impressive, however, retention should always be their highest priority. To increase retention, use a few of these strategies:
- Continue to A/B Test.
- Continue to enhance an individualized experience with liquid content.
- Remarket to users who have churned from your app via. non-mobile channels to bring them back.
- Engage with users using Rich Push and Geo-Push
- Check out our 2019 App Marketing Guide!
For more juicy data, take a peek at the benchmark report here:

Methodology
Localytics is the leading mobile engagement platform across more than 2 billion devices and 12,000 mobile and web apps. Localytics processes 3 billion data points daily. For this analysis, Localytics examined increases in user retention after one month, two months, and three months since the first half of 2017. Push and in-app open rates were calculated using the total number of interactions users had with messages within one day of receipt divided by the total number of message receipts. Push and In-App conversion rates were calculated using total users who converted divided by total users who received messages within one day. Personalization levels were determined using the percent of campaigns that were targeted based on behavioral and/or profile criteria, the percent of campaigns that used liquid content, and the percent of campaigns that were A/B tested. All data is based on Travel and Lifestyle app usage.